Project progress
EBSD datasets
As-Recived, and heat treated ones at 400, 525, 650, and 775 F
Here are collcetd data:
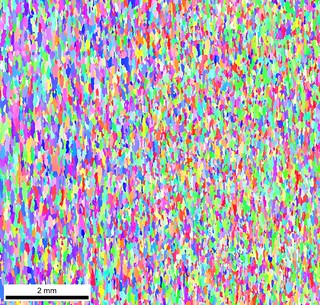
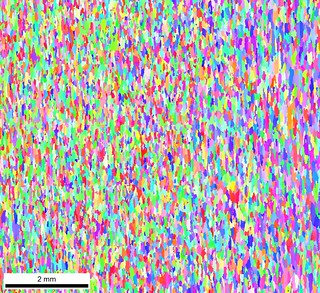
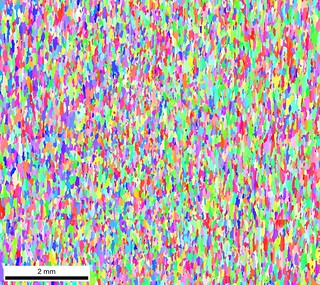
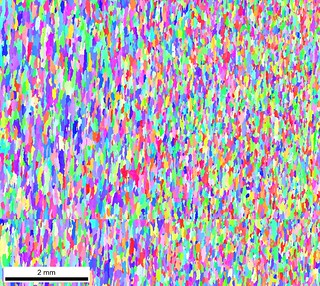
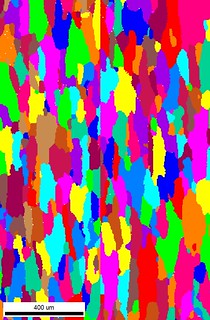
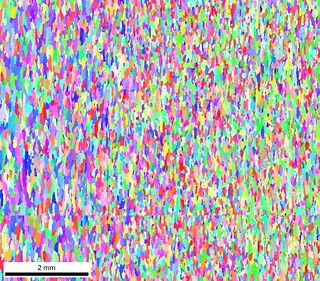 IPF maps of AR, 400, 525, 650, 775 Samples
Pole figures related to each sample are shown below:
Pole figures show small change in texture during aging process
Here is an example of Grain Size distribution for As-Received sample
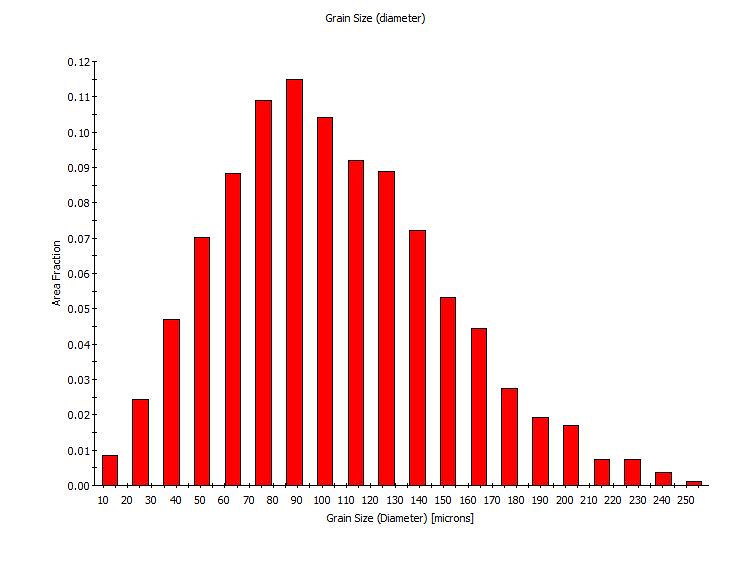
The GS distribution is from each large map which contains 75 smaller scans. When TSl software put smaller maps together, it cannot stitch grains at the edge of scan. The grain on each side of stitching line has different orientations, This is an artifact caused by inaccurate measurement by titlted beam at the edge of large scan.
Here is an example of the issue:
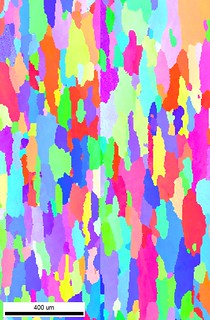
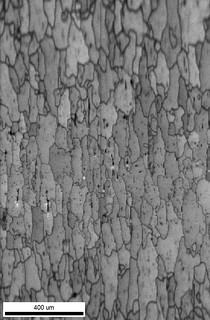
“TSL software splits grains at the edge of each scan. In the Grain ID map, you can see grains splitted into two along stitching line”
Optical and SEM images
As-Recived, and heat treated ones at 400, 525, 650, and 775 F
The constituent particles
Here are images at 5X for AR, 400, 525, 650, 775 Samples
Morphology of particles are more visible at higher magnification, here are example at 50X
2-point spatial statistics on these particles on OM images to provide folowwing information:
- Volume fraction
- Size (microns)
- Aspect ratio
- Spacing (microns)
Precipitate particles
Here are SEM images at a constatnt field of view for AR, 400, 525, 650, 775 Samples
A close up example of precipitates particle in SEM image
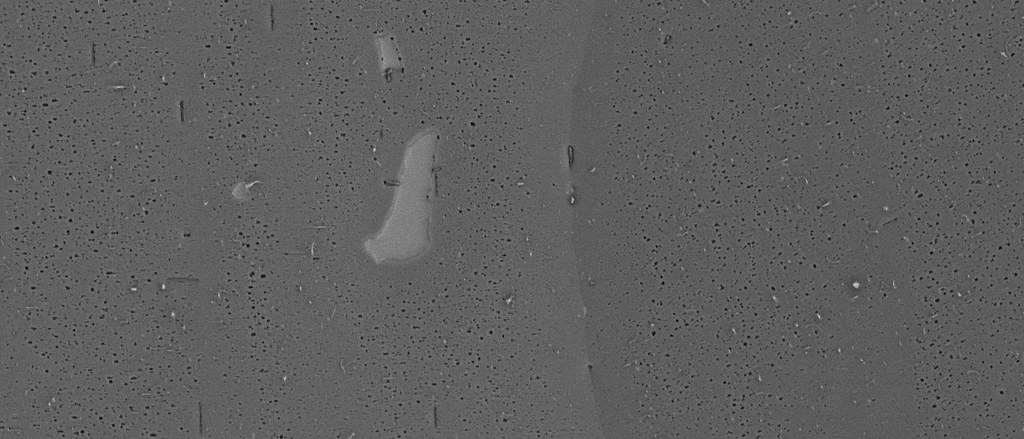
2-point spatial statistics on percipitates on SEM images to provide folowwing information:
- Volume fraction
- Size (microns)
- Aspect ratio
- Spacing (microns)
Next Steps
- Fix the orientation issue for edge grains in attaching EBSD batches
- 2-point spatial statistics on percipitates using either SEM or OM images